Website ROI: How to Measure What Your Website Actually Earns Your Business
Ask ten business owners how much revenue their website generates and nine of them will give you a guess. Not a calculation — a guess, usually framed as “it brings us some business” or “most clients find us online.” The tenth will look uncomfortable and admit they have no idea.
This is not a technology problem. It is a measurement problem. Every website in 2026 is capable of being measured — with free tools, in less time than most people spend in a single meeting. The gap between businesses that know their website’s commercial value and those that do not is not access to tools. It is knowing which metrics to look at, which formulas to apply, and how to connect website activity to actual business revenue.
This guide closes that gap completely. By the end, you will have a working framework for calculating your website’s current revenue contribution, the specific measurement setup needed to track it accurately, the benchmarks to compare your performance against, and — critically — the ability to have a specific, evidence-based conversation about whether your website investment is justified and what improving it is worth.

Why Most Businesses Do Not Know Their Website ROI
The absence of website ROI measurement is almost never deliberate negligence — it is a combination of three common situations that leave businesses flying blind on one of their most significant commercial assets.
Situation 1: No Conversion Tracking Configured
Google Analytics 4 is installed on most business websites. But GA4 out of the box only tracks page views and sessions — it does not automatically know when a form has been submitted, a phone number clicked, an email sent, or a purchase completed. Without conversion event tracking configured, GA4 can tell you how many people visited your website but not what any of them did that mattered commercially. This is the most common gap — the tool is there, but it is tracking the wrong things.
Situation 2: Website Revenue Not Separated from Other Revenue
For service businesses, website enquiries are typically processed alongside referral leads, networking contacts, repeat client requests, and inbound calls. Unless these are tagged by source at the point of entry (which requires a CRM or at minimum a consistent enquiry recording habit), it becomes impossible to identify which revenue came from the website versus other channels. The website may be generating 60% of a business’s leads, but if those leads are not tagged as website-originated, the contribution is invisible.
Situation 3: Website Treated as a Cost, Not an Investment
Many businesses treat website spending as a fixed cost — like rent or software subscriptions — rather than as an investment in a revenue-generating asset. This framing removes the analytical question. You do not typically calculate the ROI of your office lease. When the website is budgeted and thought about the same way, the measurement question never gets asked. Shifting the framing from “what does our website cost?” to “what does our website earn?” is the mental model change that makes measurement feel urgent rather than optional.
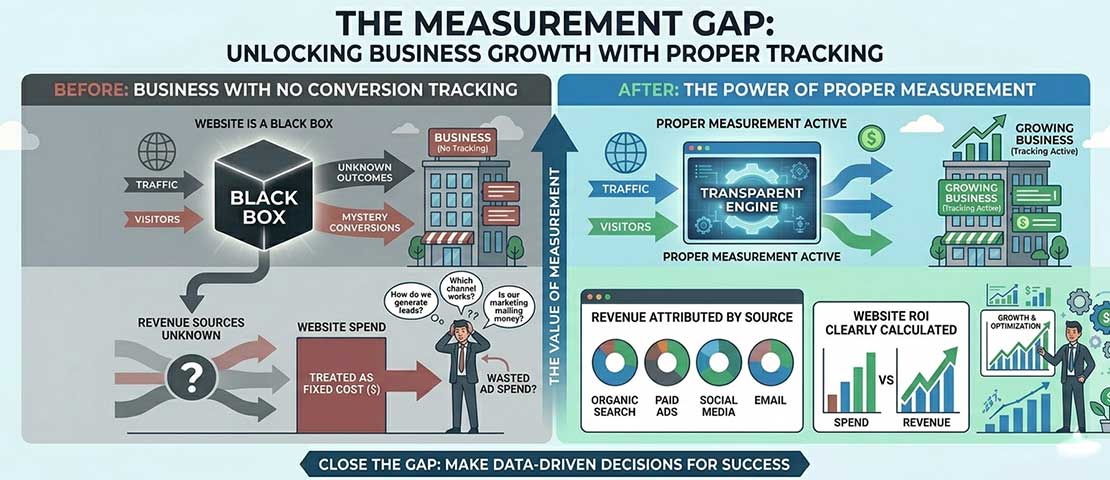
The measurement gap is not a technology gap — it is a configuration gap. The same free tools that most businesses already have installed can generate complete website ROI data when properly configured with conversion tracking and attribution.
The 4 Website Revenue Models and How to Measure Each
Websites generate revenue through fundamentally different mechanisms depending on the business model. The right measurement approach depends on which model your website uses — or which combination of models.
Model 1: Lead Generation (Service Businesses)
The website’s job is to convert visitors into enquiries — form submissions, phone calls, email contacts. Revenue is generated downstream when those enquiries become paid clients. This is the most common model for professional service businesses, agencies, consultancies, and local service providers.
Measurement approach:
- Track form submissions as GA4 conversion events
- Track phone clicks (tel: links) as conversion events
- Record the lead source in your CRM at point of contact
- Track close rate: what percentage of website leads become clients
- Calculate: Website leads × Close rate × Average client value = Monthly website revenue attribution
Model 2: Direct eCommerce
The website directly processes purchases. Revenue is immediately attributable and precisely measurable through GA4 eCommerce tracking or your eCommerce platform’s native analytics (Shopify Analytics, WooCommerce reports).
Measurement approach:
- Enable GA4 eCommerce tracking (or use Shopify/WooCommerce native reporting)
- Track: revenue by traffic source, conversion rate, average order value, revenue per visitor
- Calculate: Total website revenue directly from analytics reports
Model 3: Hybrid (Content + Conversion)
The website generates organic traffic through content (blog posts, guides, tools), which converts to leads or subscriptions over multiple visits. Common for SaaS businesses, agencies with active content marketing, and subscription services.
Measurement approach:
- Track the conversion event (trial signup, subscription, contact form)
- Use multi-touch attribution to understand which content assisted the conversion
- Calculate: Content traffic × Conversion rate × Customer lifetime value = Content-attributed revenue
Model 4: Brand and Credibility (Support to Other Channels)
The website primarily functions as a credibility validator — prospects arrive from other channels (networking, referral, advertising) and check the website before making contact decisions. Revenue attributable directly to the website is low; revenue lost due to a poor website experience is the real measure.
Measurement approach:
- Track which prospects visited the website before making contact (CRM integration)
- Track the conversion rate of prospects who visited vs those who did not
- The ROI case is built on: poor website = lower conversion rate from all channels
Setting Up GA4 Conversion Tracking — The Essential Foundation
None of the measurement that follows is possible without conversion events properly configured in GA4. This is a one-time setup task that most businesses have never completed — and its absence is why most website ROI calculations are guesses rather than calculations.
-
Access GA4 Admin and create a conversion event for each form submission
GA4 Admin → Events → Create Event. For contact forms, the most reliable approach is tracking a “thank you page” view as the conversion event — configure the form to redirect to /thank-you/ after submission, then track a page_view event on that URL as a conversion. This works for any form without requiring code changes or developer access. Alternatively, ask your developer to add a gtag(‘event’, ‘form_submission’) call to the form’s success handler. -
Track phone number clicks
If your website displays a phone number, clicks on that number (via tel: links) are high-intent conversion events that most businesses miss entirely. In GA4, configure an event that fires when a visitor clicks your phone number link. The Google Tag Manager implementation: trigger a Tag on Click URL containing your phone number, fire a GA4 Event with event_name “phone_click”. -
Track email link clicks
Similarly, clicks on mailto: links represent direct conversion intent. Configure these as GA4 events using the same approach — a trigger on Click URL containing “mailto:” firing a “email_click” event. -
For eCommerce: enable the GA4 eCommerce data layer
Shopify: install the GA4 integration through the Shopify admin (Preferences → Google and YouTube channel). WooCommerce: install the Google Listings and Ads plugin or configure the Google Tag Manager eCommerce data layer. This enables purchase events, add_to_cart events, and begin_checkout events to flow into GA4 automatically. -
Assign monetary value to non-eCommerce conversions
In GA4, form submission events can be assigned a monetary value — your average revenue per website lead. GA4 Admin → Conversions → select your form event → Edit → add a default conversion value. If your average website lead converts to a £500 project 30% of the time, assign a value of £150 (£500 × 30% close rate). This allows GA4 to report estimated revenue from lead generation, not just event counts.
The Complete Website ROI Formula
Once conversion tracking is in place, the ROI calculation uses a straightforward formula. Here are worked examples for both service business (lead generation) and eCommerce models:
Service Business ROI Formula
Monthly Website Revenue =
  Monthly Website Leads
  × Lead-to-Client Close Rate (%)
  × Average Client Value (£/$/₹)

Example:
  42 form submissions from website per month
  × 28% close rate (from CRM data)
  × £1,800 average project value
  = £21,168 monthly revenue attributed to website

Annual website revenue: £21,168 × 12 = £254,016

Website investment this year:
  Annual hosting:              £800
  Maintenance retainer:        £2,400
  Content / SEO investment:    £3,600
  Original build amortised:    £3,000
  Total annual investment:     £9,800

Website ROI:
  (£254,016 - £9,800) ÷ £9,800 × 100 = 2,491% ROI
The most important number in this calculation: Your lead-to-client close rate. If you do not track this, start now. Record every website enquiry that comes in, and track whether it became a client. After 3 months you will have a real close rate to use in your calculations — typically between 15% and 45% for professional service businesses, depending on your market and pricing.
eCommerce ROI Formula
Monthly eCommerce Website Revenue:
  Directly available in GA4 → Reports → Monetisation → Overview
  Or: Shopify/WooCommerce analytics dashboard

eCommerce ROI =
  (Monthly Revenue - Monthly Website Investment)
  ──────────────────────────────────────────────
           Monthly Website Investment
  × 100

Example:
  Monthly website revenue:       £18,400
  Monthly website investment:    £1,100
  (hosting, maintenance, tools)

  ROI = (£18,400 - £1,100) ÷ £1,100 × 100 = 1,572% monthly ROI
Attribution: How to Credit Revenue to the Right Source
Attribution is the discipline of deciding which marketing touchpoint deserves credit for a conversion. It matters for website ROI because most conversions involve multiple touchpoints — a prospect might find you through Google organic search, read three blog posts over two weeks, click a Google Ads ad, and then submit a contact form. Which touchpoint gets the credit?
| Attribution Model | How It Works | Best For | Risk |
|---|---|---|---|
| Last Click | 100% credit to the final touchpoint before conversion | Simple reporting, understanding final conversion drivers | Undervalues awareness channels (SEO, social) |
| First Click | 100% credit to the first touchpoint in the journey | Understanding how prospects discover you initially | Undervalues closing channels (branded search, direct) |
| Linear | Equal credit split across all touchpoints | Balanced view of multi-touch journeys | No touchpoints are weighted by actual impact |
| Data-Driven (GA4 default) | ML model assigns credit based on measured conversion probability | Most accurate for businesses with sufficient conversion volume | Requires 50+ conversions/month to work effectively |
For most small and medium businesses, a pragmatic approach works well: use GA4’s data-driven attribution for your primary reporting, and run a secondary “first click” report to understand how organic search and content contribute to journeys that convert through other channels. This combination gives a complete picture of your website’s role in the revenue journey without requiring advanced analytics configuration.
Industry Benchmarks for Conversion Rates and Revenue Per Visitor
Knowing your website’s current performance is only meaningful in context. These benchmarks allow you to evaluate whether your website is performing at, above, or below the standard for your business type.
| Business Type | Avg. Conversion Rate | Top 25% | Top 10% | Avg. Rev/Visitor |
|---|---|---|---|---|
| Professional services (agencies, consultants) | 2.0 – 3.5% | 5.0% | 9.0%+ | £8 – £45 |
| B2B technology / SaaS | 2.5 – 5.0% | 6.5% | 11.0%+ | £12 – £80 |
| eCommerce — general retail | 1.5 – 3.5% | 5.5% | 11.5%+ | £0.90 – £3.20 |
| eCommerce — luxury / high-ticket | 0.5 – 1.5% | 2.5% | 5.0%+ | £8 – £65 |
| Local services (tradespeople, salons) | 3.5 – 7.0% | 9.0% | 15.0%+ | £15 – £90 |
| Healthcare and medical | 3.0 – 5.5% | 7.5% | 12.0%+ | £20 – £120 |
| Legal services | 2.5 – 4.5% | 6.5% | 11.0%+ | £25 – £150 |
| Education and training | 2.0 – 4.0% | 5.5% | 10.0%+ | £5 – £35 |
How to use these benchmarks: Find your business type, compare your current conversion rate to the average. If you are at or below the average, improving to the top 25% through conversion rate optimisation — better design, clearer CTAs, stronger social proof, faster load time — is a high-ROI investment. If you are already at or above the top 25%, your investment priority shifts to increasing traffic rather than improving conversion.
The 6 Metrics Your Website Dashboard Must Show Every Week
Total Conversions (and by type)
How many enquiries, form submissions, phone clicks, or purchases did the website generate this week? This is the primary output metric — everything else is in service of understanding and improving this number.
Conversion Rate by Traffic Source
Not all traffic converts equally. Organic search visitors typically convert at different rates than paid, social, or direct visitors. Knowing which sources convert best informs where to invest more traffic budget.
Organic Traffic Volume and Trend
How many people are finding your website through search this week versus last week, last month, last year? Organic traffic growth is a leading indicator of SEO investment paying off; a declining trend is an early warning of a problem.
Revenue per Visitor (or Estimated Revenue per Lead)
The single most useful cross-metric calculation — total attributed revenue divided by total visitors. Improving this number means either converting more visitors or attracting visitors who are worth more per conversion.
Top Converting Pages
Which specific pages generate the most conversions? These are your highest-value pages — they deserve the most ongoing attention, the freshest content, and the most careful CRO work. They also reveal what content your audience responds to.
Page Speed (Core Web Vitals)
A single weekly check — visit Google Search Console → Core Web Vitals. Any pages moving from “Good” to “Needs Improvement” need attention before they become a conversion problem. Speed is money.
How to Build a Simple Website Revenue Report in GA4
GA4’s Exploration reports allow custom dashboard creation that pulls the specific metrics into one view. Here is the most useful configuration for a weekly website revenue check:
GA4 → Explore → Blank Exploration

Dimensions:
  - Session source / medium
  - Landing page + query string

Metrics:
  - Sessions
  - Conversions (your key conversion event)
  - Conversion rate
  - Total revenue (if eCommerce) OR
    Event value (if using assigned conversion values)

Filters:
  - Date range: Last 28 days vs Previous 28 days
  - Comparison: Shows week-over-week trend

Save as: "Weekly Website Revenue Report"
Schedule: Set a recurring email reminder every Monday morning
to open this report and note the key numbers.
This report, reviewed weekly, gives you the full picture: which traffic sources are converting and at what rate, which landing pages are the strongest performers, and how this week compares to the month before. Fifteen minutes per week reviewing this data produces more commercial insight than most businesses get from quarterly reviews.
What Good Website ROI Looks Like — and When to Invest More
Once you have your website’s current ROI calculated, the next question is: what should it be? And at what point does more investment become justified?
| ROI Category | Annual ROI Range | What It Suggests | Action |
|---|---|---|---|
| Exceptional | 1,000%+ | Website is highly efficient; may be underinvested relative to opportunity | Increase traffic investment (SEO, content, ads) — more visitors to a converting site = proportional revenue |
| Strong | 300 – 1,000% | Website is working well commercially — strong foundation | Identify the conversion rate improvement opportunities that would move you toward exceptional |
| Average | 100 – 300% | Website is generating value but below its potential | CRO audit — identify the 2-3 highest-impact changes; consider redesign if the site is over 3 years old |
| Below Average | 0 – 100% | Website investment is not generating proportionate return | Full website audit — performance, UX, conversion architecture, SEO foundation. Redesign likely justified. |
| Negative | Below 0% | Website cost exceeds attributed revenue — fundamental problem | Immediate audit. The website may be actively losing business through poor UX, slow performance, or absent trust signals. |
Frequently Asked Questions About Website ROI
| How do I calculate the ROI of my website? | Website ROI is calculated using the formula: (Annual Website Revenue – Annual Website Investment) ÷ Annual Website Investment × 100 = ROI %. For service businesses, annual website revenue is calculated as: monthly website leads × lead-to-client close rate × average client value × 12. For eCommerce businesses, annual website revenue is taken directly from GA4 eCommerce reports or your platform’s analytics. Annual website investment includes: hosting costs, maintenance fees, any ongoing SEO or content marketing spend, and the original website build cost amortised over its expected useful life (typically 3 to 5 years). The most commonly missing ingredient is the close rate — the percentage of website enquiries that become paying clients. If you do not have this number, begin tracking it immediately in a simple spreadsheet: log every website enquiry and whether it converted. |
| What is a good conversion rate for a business website? | Average business website conversion rates vary significantly by industry and conversion action type. For professional services and agencies, the industry average is 2 to 3.5% — the top 25% achieve 5% or more. For local service businesses (tradespeople, salons, healthcare), averages are higher at 3.5 to 7%, with the top performers exceeding 10%. For eCommerce, the overall average is 1.5 to 3.5%, with significant variation by product category and price point. Rather than comparing to an industry average, the most commercially useful benchmark is your own historical conversion rate — a 20% improvement on your current rate is typically more achievable and more valuable than reaching an industry average. The specific conversion rate that is “good” for your business is the one that, multiplied by your traffic volume and average client value, generates a commercially satisfying monthly revenue attribution. |
| How does Google Analytics 4 measure website revenue? | Google Analytics 4 measures website revenue through two mechanisms. For eCommerce websites, GA4 tracks purchase events that include the transaction value — when a purchase is completed, the order value is sent to GA4 and reported under Monetisation → eCommerce purchases → Revenue. This requires the GA4 eCommerce data layer to be configured on your website, which is typically done through a plugin (Shopify, WooCommerce) or Google Tag Manager. For non-eCommerce (service business) websites, GA4 does not automatically know the monetary value of a lead — but you can assign a default conversion value to each conversion event (form submission, phone click) that represents the estimated average revenue per conversion. This value is calculated as: average client value × lead-to-client close rate. With this assigned value, GA4’s Monetisation reports show an estimated revenue figure for service business enquiries that allows the same ROI analysis eCommerce businesses perform with actual transaction data. |
| What is revenue per visitor and why does it matter? | Revenue per visitor (RPV) is calculated by dividing total attributed website revenue by total website visitors in the same period. It is the single most useful cross-metric calculation for website performance because it captures both conversion rate and average conversion value in a single number that can be tracked over time and compared across traffic sources. A website with high traffic but low conversion rates might have a low RPV. A website with modest traffic but high-value conversions might have an excellent RPV. Tracking RPV over time reveals whether website improvements are generating commercial improvement — if you improve your homepage design, does RPV go up in the following month? If you invest in SEO that brings more qualified traffic, does RPV improve because that traffic converts at a higher rate? RPV is also the most direct way to calculate the value of additional traffic investment: if your current RPV is £12 and you invest in SEO that brings 500 additional monthly visitors, the expected revenue impact is £6,000 per month — a calculation that makes traffic investment decisions quantifiable. |
| How do I track form submissions in Google Analytics 4? | The most reliable method for tracking form submissions in GA4 without developer assistance is the thank-you page method: configure your contact form to redirect visitors to a dedicated URL (e.g., /thank-you/ or /contact-success/) after successful submission, then create a GA4 conversion event that fires when a visitor lands on that URL. In GA4 Admin → Events → Create Event, set the condition: event_name equals “page_view” AND page_location contains “/thank-you/”. Mark this event as a conversion. This approach works for any form on any website platform and requires no code changes — only the form redirect configuration and the GA4 event setup. The developer-assisted method — adding a gtag event call directly to the form success handler — is slightly more accurate (it fires only on successful submissions rather than direct URL visits) but requires code access. For WordPress websites with common form plugins (WPForms, Gravity Forms, Contact Form 7), there are dedicated GA4 tracking plugins that automate conversion event firing without requiring custom code. |
| How do I know if my website needs redesigning based on ROI? | A website redesign is commercially justified based on ROI when one or more of the following conditions are true. First, your conversion rate is below the industry average for your business type and conversion rate optimisation improvements (CTA changes, social proof additions, speed improvements) have not moved it materially — suggesting the problem is fundamental to the website’s design and structure rather than specific element quality. Second, your Core Web Vitals scores are in the “Poor” category and cannot be fixed through optimisation of the existing site — some older websites have architectural performance problems that require a rebuild rather than optimisation. Third, your ROI calculation shows below-average or negative return on website investment — the website is costing more than it earns, which is the clearest possible business case for change. Fourth, the website is over 4 years old — because Google’s Core Web Vitals requirements, mobile-first standards, and SEO technical requirements have all changed significantly in that period, and older sites frequently fail against current standards in ways that directly harm commercial performance. |
| How can I increase my website’s ROI without a full redesign? | Several high-impact improvements can meaningfully increase website ROI without requiring a full redesign. Improving page speed is typically the highest-ROI single improvement — converting images to WebP, enabling caching, removing unused JavaScript — and can produce 20 to 40% conversion rate improvements on slow sites by reducing the bounce rate caused by load time. Improving CTA clarity and placement — ensuring every key page has one prominent, specific CTA with clear micro-copy that reduces hesitation — consistently produces 10 to 30% conversion improvements in A/B tests. Adding and upgrading social proof — replacing generic testimonials with specific, attributed quotes with real photos, adding Google Review widgets, featuring recognisable client logos — builds trust that directly improves conversion rates. Improving mobile UX on your highest-traffic pages — since over 60% of web traffic is mobile, a checkout or contact page that is difficult to complete on a phone loses a majority of its potential conversions. Adding live chat or a chatbot to capture visitors who are hesitant to submit a form can add 15 to 25% additional lead capture from existing traffic. None of these requires a redesign — they are targeted improvements to specific conversion barriers on your existing site. |
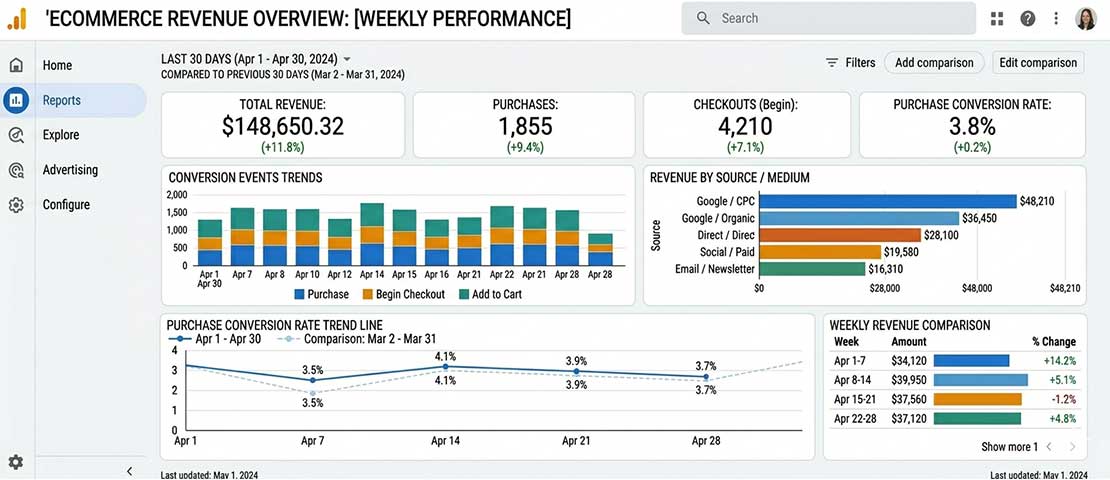
A properly configured GA4 dashboard for website ROI measurement — showing conversion events by source, estimated revenue attribution, and week-over-week trends — turns a guessing exercise into a weekly 15-minute evidence review.

The reward for doing the measurement work is commercial clarity — knowing exactly what your website earns, whether it is earning its keep, and precisely what improving it is worth to your business.
Want to know what your website is actually earning your business?
Neel Networks conducts website audits that include full GA4 conversion setup, ROI baseline calculations, and a prioritised improvement roadmap — so you know exactly what your website is worth and what improving it is worth. Talk to our team about a website ROI audit for your business.