Website Speed Optimization Guide 2026: Boost Performance & Business Revenue
Every second your website takes to load is costing you money. This is not a vague claim — it is a well-documented, specifically quantified reality. Amazon calculated that every 100 milliseconds of load time cost them 1% of sales. Google found that mobile pages taking 3 seconds to load have a 53% abandonment rate. For an average business website, improving load time from 5 seconds to 2 seconds can increase conversion rates by 74%.
What this guide covers
- 1. Why Website Speed Directly Impacts Your Business Revenue
- 2. Core Web Vitals Explained: The Three Metrics That Affect Your Google Rankings
- 3. Key Performance Metrics Beyond Core Web Vitals
- 4. Image Optimisation: The Single Biggest Speed Win
- 5. Technical Fixes Ranked by Impact
- 6. WordPress-Specific Performance Improvements
- 7. Measuring and Monitoring: The Essential Performance Toolkit
- 8. Frequently Asked Questions About Website Speed Optimisation
Website speed is not a technical nicety. It is a revenue lever — one of the most directly impactful and most underinvested areas of website optimisation for most businesses. And in 2026, its importance has increased further: Google’s Core Web Vitals are direct ranking factors, meaning a slow website does not just lose visitors who arrive — it loses the chance to attract them in the first place through search.
This guide covers everything you need to improve your website’s speed: the key metrics to measure, the image optimisation techniques that deliver the biggest gains, the tools to diagnose problems, and the technical fixes that move the needle most significantly.
Why Website Speed Directly Impacts Your Business Revenue
The relationship between website speed and business outcomes is one of the most comprehensively researched topics in digital marketing. The data is unambiguous:
- 53% of mobile users abandon a site that takes more than 3 seconds to load (Google research)
- Every 1-second delay in page response results in a 7% reduction in conversions (Akamai research)
- A page that loads in 1 second has a 3x higher conversion rate than one that loads in 5 seconds (Portent research)
- Google uses Core Web Vitals as direct ranking factors — slow sites rank lower, receiving less organic traffic regardless of content quality
- Bounce rate increases by 32% as page load time goes from 1 to 3 seconds, and by 90% as it goes from 1 to 5 seconds (Google/SOASTA research)
The compounding effect is significant: a slow website simultaneously reduces the traffic you attract (lower rankings), increases the proportion of visitors who leave immediately (higher bounce rate), and reduces the proportion of remaining visitors who convert (lower conversion rate). Fixing website speed addresses all three problems simultaneously.
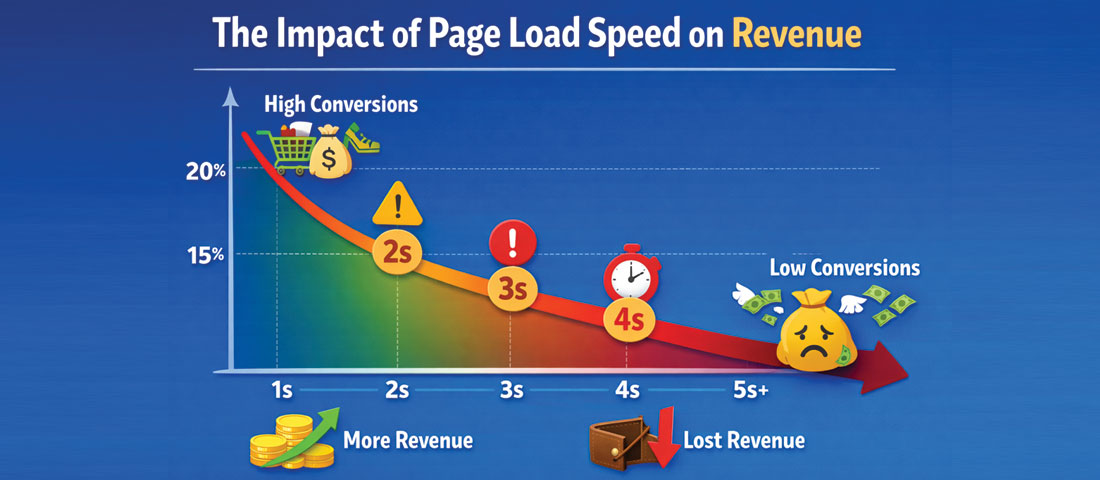
The relationship between page load time and conversion rate is direct and measurable — every additional second costs you a significant percentage of conversions.
Core Web Vitals Explained: The Three Metrics That Affect Your Google Rankings
Google’s Core Web Vitals are the specific performance measurements that Google uses as direct ranking signals. Understanding what they measure and what “good” looks like is the starting point for any performance improvement programme.
Largest Contentful Paint (LCP) — Load Performance
LCP measures the time from when a page starts loading to when the largest visible content element (typically a hero image, headline, or large text block) becomes visible in the viewport. LCP tells you how quickly the main content of your page appears to users.
- Good: Under 2.5 seconds
- Needs improvement: 2.5 to 4.0 seconds
- Poor: Over 4.0 seconds
LCP is typically the most impactful Core Web Vital to fix, because it directly measures the user’s perception of “has the page loaded yet?” The most common LCP culprits are unoptimised hero images, render-blocking JavaScript, and slow server response times.
Interaction to Next Paint (INP) — Interactivity
INP (which replaced First Input Delay in March 2024) measures the latency of all interactions a user makes with a page — clicks, taps, keyboard inputs — throughout their entire session. It captures the worst interaction delay and uses that as the representative score. INP tells you how responsive your page feels during use.
- Good: Under 200 milliseconds
- Needs improvement: 200 to 500 milliseconds
- Poor: Over 500 milliseconds
Cumulative Layout Shift (CLS) — Visual Stability
CLS measures how much the visible page layout shifts unexpectedly as the page loads. You have experienced poor CLS when you go to click a button and it suddenly moves because an image loaded above it, or when text reflows unexpectedly. CLS creates frustration and accidental clicks.
- Good: Under 0.1
- Needs improvement: 0.1 to 0.25
- Poor: Over 0.25
Key Performance Metrics Beyond Core Web Vitals
While Core Web Vitals are the most commercially significant metrics, a comprehensive performance picture includes several additional measurements:
| Metric | What It Measures | Good Target | Primary Tool |
|---|---|---|---|
| Time to First Byte (TTFB) | How quickly the server responds to the initial request | Under 800ms | PageSpeed Insights, GTmetrix |
| First Contentful Paint (FCP) | When the first content element appears on screen | Under 1.8 seconds | PageSpeed Insights, Lighthouse |
| Total Blocking Time (TBT) | Time the main thread is blocked from responding to input | Under 200ms | Lighthouse, WebPageTest |
| Speed Index | How quickly the visible content of a page is visually populated | Under 3.4 seconds | Lighthouse, GTmetrix |
| Page Weight (Total Size) | Total size of all resources needed to load the page | Under 2MB ideal | GTmetrix, WebPageTest |
Image Optimisation: The Single Biggest Speed Win
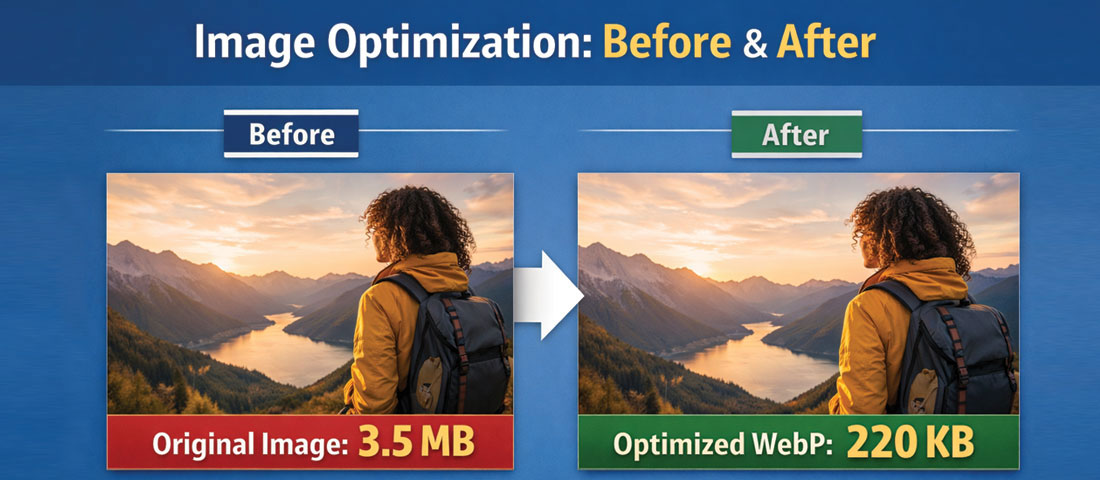
Converting and compressing images to modern formats like WebP can reduce image file sizes by 25–35% compared to JPEG, with no visible quality loss — making it the single highest-impact speed improvement for most websites.
Images are typically the largest contributor to page weight on a poorly optimised website — often accounting for 60 to 80% of total page size. Optimising images is therefore the single most impactful speed improvement available to most websites, and it is one of the most accessible — requiring no development expertise to implement with the right tools.
Use Modern Image Formats: WebP and AVIF
JPEG and PNG have been the standard web image formats for decades, but they are not the most efficient options available in 2026. WebP, developed by Google, offers 25 to 35% smaller file sizes than JPEG at equivalent visual quality. AVIF, the newer alternative, offers even better compression — 50% smaller than JPEG in many cases — though browser support, while now very good, is slightly less universal than WebP.
The practical recommendation for 2026: serve WebP as the default format for all photographic images, with JPEG as a fallback for older browsers. Use AVIF where the additional compression benefit justifies the slightly smaller browser support profile. Both formats are supported by all major modern browsers including Chrome, Firefox, Safari, and Edge.
Compress All Images Before Upload
Even WebP images benefit from compression before upload. Serving a 3MB WebP file when a 200KB WebP file looks identical to the human eye is a waste of bandwidth and load time. Tools like Squoosh (free, browser-based), TinyPNG/TinyJPEG (free for small volumes), and ShortPixel (WordPress plugin) compress images to the smallest file size at an acceptable quality level.
Serve Correctly Sized Images
One of the most common image performance mistakes is uploading a 2000-pixel-wide image for a thumbnail that displays at 300 pixels. The browser downloads the full 2000px image and then scales it down in the display layer — wasting bandwidth on pixels that are never shown. Use responsive images with srcset attributes to serve appropriately sized images for each screen size, and always size images to the maximum dimensions at which they will actually be displayed.
Implement Lazy Loading
Lazy loading delays the loading of images that are below the viewport (not immediately visible to the user) until they are about to scroll into view. This significantly reduces the initial page load time and the amount of data loaded on pages that users do not scroll to the bottom of. In 2026, native lazy loading is implemented simply with the loading="lazy" attribute on image tags — no JavaScript library required. (Note: never lazy-load the hero/LCP image — it needs to load immediately.)
8 Image Optimisation Tools Worth Knowing
Squoosh
Google’s browser-based image compression tool. Supports WebP, AVIF, JPEG, PNG. Shows side-by-side quality comparison as you adjust compression. Excellent for manual optimisation of key images.
ShortPixel
WordPress plugin that automatically compresses and converts images to WebP on upload. 100 free compressions per month; affordable paid plans. One of the most popular image optimisation plugins.
TinyPNG / TinyJPEG
Simple browser-based compression for PNG and JPEG files. Free for up to 20 images per month. Produces excellent results with minimal quality loss. Also available as a WordPress plugin.
Cloudinary
Enterprise-grade image and video management with automatic format conversion, intelligent cropping, and CDN delivery. Ideal for eCommerce or media-heavy sites with large image libraries.
Imagify
WordPress plugin with three compression levels (lossless, lossy, ultra). Automatically converts to WebP. Integrates with popular page builders. 20MB free per month.
EWWW Image Optimizer
Comprehensive WordPress image optimisation plugin. Processes images on your server (no external service dependency). Supports WebP conversion and lazy loading. Free core plugin.
Technical Fixes Ranked by Impact
Beyond image optimisation, here are the most impactful technical improvements, ranked by the typical performance gain they deliver:
-
Upgrade to quality hosting or add a CDN
Server response time (TTFB) is the foundation of all other performance metrics. A slow server makes everything else slower regardless of how well-optimised the code and images are. Upgrading from shared hosting to managed WordPress hosting (WP Engine, Kinsta, SiteGround, Cloudways) or adding a CDN (Cloudflare’s free plan is sufficient for most businesses) typically produces the most dramatic single performance improvement — reducing TTFB from 500–800ms to under 200ms. -
Implement server-side and browser caching
Caching stores pre-built versions of your pages so the server does not have to rebuild them from scratch for every visitor. For WordPress, caching plugins like WP Rocket, W3 Total Cache, or LiteSpeed Cache implement both server-side and browser caching with minimal configuration. A well-configured caching setup can reduce server load by 80% and dramatically improve load times for repeat visitors. -
Minify and combine CSS and JavaScript files
Minification removes unnecessary whitespace, comments, and characters from CSS and JavaScript files, reducing their file size. Combining multiple files into fewer requests reduces the number of HTTP requests the browser must make. Both operations are typically handled automatically by caching plugins and performance plugins in WordPress. For custom-coded websites, build tools like Webpack and Vite handle this during the build process. -
Eliminate render-blocking resources
CSS and JavaScript files that are loaded in the<head>of a page block the browser from rendering any visible content until they have finished downloading and processing. Moving non-critical JavaScript to load asynchronously or deferred (after the page has rendered), and inlining only the critical CSS needed for above-the-fold content, can significantly improve LCP and FCP scores. -
Reduce third-party scripts
Every third-party script loaded on your website — analytics, chat widgets, social media embeds, ad pixels, heatmap tools — adds HTTP requests and JavaScript execution time. Audit every third-party script on your site and ask whether each one is genuinely earning its performance cost. Load non-essential scripts asynchronously or with a delay after the main page has loaded. Use Google Tag Manager to consolidate and delay script loading. -
Set explicit width and height on all images
Setting explicitwidthandheightattributes on all image elements allows the browser to reserve the correct space for the image before it loads — preventing layout shift (CLS). This is a simple change with a direct, measurable impact on CLS scores, particularly on pages with many images.
WordPress-Specific Performance Improvements
For the majority of business websites — which run on WordPress — several platform-specific optimisations are particularly impactful:
- Choose a performance-optimised theme. Heavy, feature-bloated themes (particularly some popular premium themes) load dozens of unnecessary CSS files and JavaScript libraries on every page. Lightweight themes like GeneratePress, Kadence, or Blocksy are specifically designed for performance and consistently achieve better Core Web Vitals scores than heavier alternatives.
- Use a page builder carefully. Page builders like Elementor and Divi are powerful but add significant page weight. If you use a page builder, choose one with a reputation for performance (Bricks Builder and GenerateBlocks are leading lightweight alternatives in 2026) and regularly audit which builder assets are being loaded on which pages.
- Disable and remove unused plugins. Every active WordPress plugin adds database queries and potentially JavaScript/CSS to your pages. Audit your plugin list regularly: deactivate and delete any plugins that are not actively needed. Replace multiple single-function plugins with fewer multi-function alternatives where possible.
- Optimise the WordPress database. Over time, the WordPress database accumulates overhead — post revisions, deleted content, transients, and other data that is no longer needed. Database optimisation plugins like WP-Optimize clean this accumulated overhead, reducing database query time and improving overall server response.
- Use a dedicated WordPress performance plugin. WP Rocket (paid) and LiteSpeed Cache (free on LiteSpeed servers) are the two most effective all-in-one WordPress performance plugins in 2026. They handle caching, minification, lazy loading, database optimisation, and several other performance improvements in a single plugin with straightforward configuration.
Measuring and Monitoring: The Essential Performance Toolkit
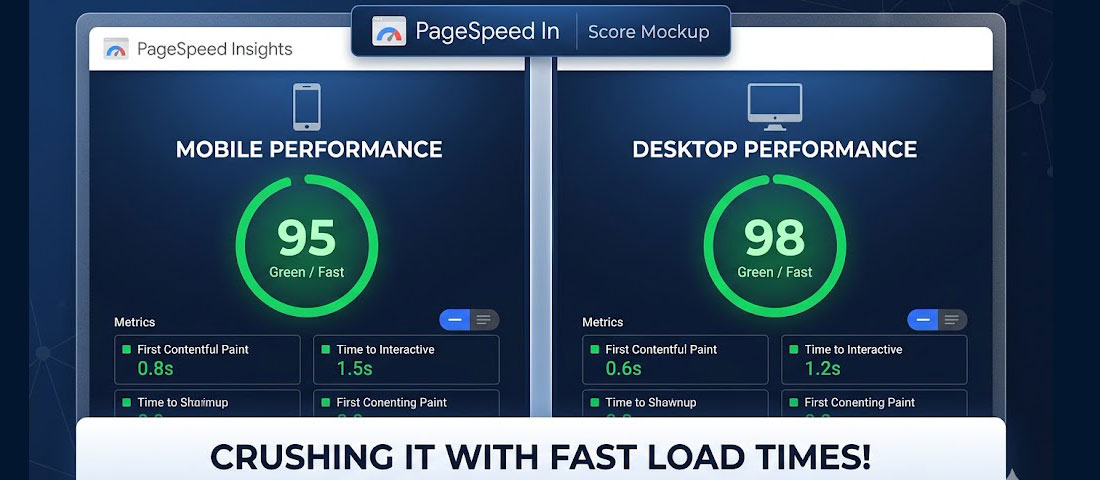
Google PageSpeed Insights provides free, authoritative performance scores and specific improvement recommendations for any URL.
- Google PageSpeed Insights (pagespeed.web.dev) — The primary free tool for measuring Core Web Vitals and receiving specific improvement recommendations. Tests both mobile and desktop. Uses both lab data and real-world CrUX data where available. Test with this first.
- Google Search Console — The “Core Web Vitals” report under “Experience” shows how your pages are performing in real-world conditions across all of Google’s data. Identifies specific pages with “Poor” or “Needs improvement” scores and the specific issues causing them.
- GTmetrix — Provides a detailed performance waterfall showing exactly which resources are loading, in what order, and how long each takes. Excellent for diagnosing specific bottlenecks. Free tier available.
- WebPageTest (webpagetest.org) — The most technically detailed free performance testing tool. Allows testing from multiple global locations, multiple connection speeds, and provides filmstrip views showing exactly how the page renders frame by frame.
- Chrome DevTools — The built-in browser performance tools in Chrome provide detailed Lighthouse audits, network request analysis, and performance profiling for any page. The best tool for developers diagnosing specific performance issues in detail.
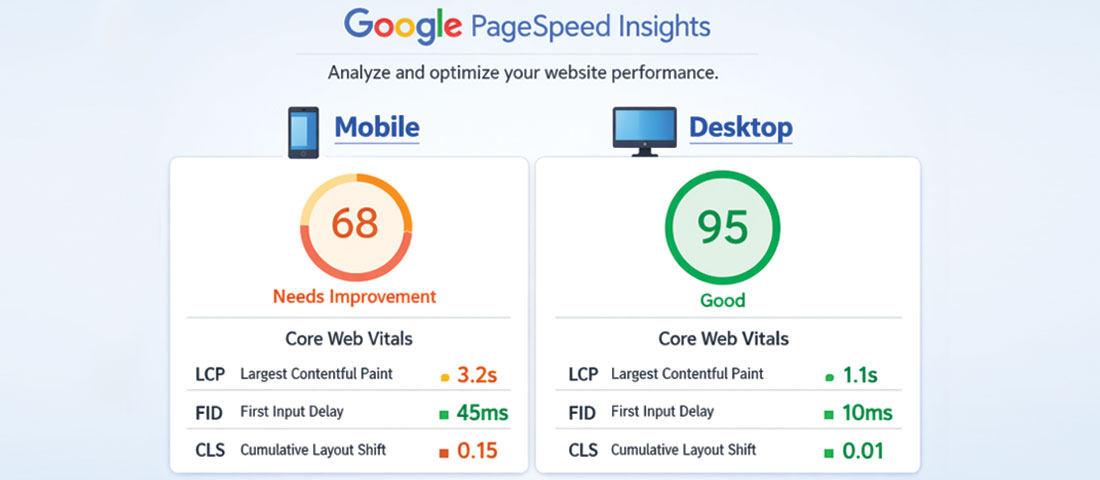
Performance testing tip: Always test your website on mobile using PageSpeed Insights — not just desktop. Mobile scores are almost always significantly lower than desktop scores, and since Google uses mobile-first indexing, your mobile Core Web Vitals score is the one that affects your Google rankings. Many businesses are surprised to discover that their website, which feels fast on their office desktop, scores poorly on mobile.
Frequently Asked Questions About Website Speed Optimisation
| How does website speed affect SEO rankings? | Website speed affects SEO rankings directly through Google’s Core Web Vitals, which are confirmed ranking signals. Websites that pass the Core Web Vitals thresholds (LCP under 2.5 seconds, INP under 200ms, CLS under 0.1) receive a positive ranking signal; those that fail receive a negative one. Beyond the direct ranking signal, speed affects SEO indirectly through user behaviour metrics: faster pages have lower bounce rates and longer session durations, which signal to Google that users find the page valuable. In competitive search results where multiple pages are closely matched on content quality and authority, Core Web Vitals performance can be the tiebreaker. |
| What is a good website speed score in 2026? | For Google PageSpeed Insights, a score of 90 or above is considered “Good” for both mobile and desktop. A score of 50 to 89 is “Needs Improvement,” and below 50 is “Poor.” More importantly than the overall score, the individual Core Web Vitals should be in the “Good” range: LCP under 2.5 seconds, INP under 200ms, and CLS under 0.1. Many professional websites struggle to achieve mobile scores above 80, particularly if they use heavy page builders or have many third-party scripts — making even reaching the 50–75 mobile range a meaningful improvement for underperforming sites. |
| What is the single most impactful website speed improvement? | For most websites, image optimisation delivers the single largest performance improvement per unit of effort. Images typically account for 60 to 80% of total page weight on unoptimised websites. Converting images to WebP format and compressing them appropriately can reduce total page weight by 30 to 50%, directly improving LCP and overall load time. The second most impactful improvement is typically upgrading to quality hosting or implementing a CDN, which reduces Time to First Byte and benefits all subsequent performance metrics. Both improvements are accessible without advanced technical knowledge using the right tools and plugins. |
| What is the best WordPress caching plugin for speed in 2026? | WP Rocket is consistently rated the most effective all-in-one WordPress performance plugin in 2026 — it handles page caching, browser caching, CSS and JavaScript minification, lazy loading, database optimisation, and CDN integration in a single plugin with a clean interface that does not require technical expertise to configure. It is a paid plugin (approximately $49 to $249 per year depending on the number of sites). For WordPress sites hosted on LiteSpeed servers (including many quality shared and managed WordPress hosts), LiteSpeed Cache is a free alternative that provides comparable performance through its native server-level integration. |
| How do I check my website’s Core Web Vitals? | The best way to check your website’s Core Web Vitals is through Google Search Console — navigate to “Experience” then “Core Web Vitals” to see real-world performance data for all your pages, categorised as Good, Needs Improvement, or Poor. For immediate testing of any URL, use Google PageSpeed Insights (pagespeed.web.dev) — enter your URL and it will return both lab-measured Core Web Vitals and, where available, real-world CrUX data from actual Chrome users visiting your site. For more detailed diagnostics, GTmetrix provides a comprehensive performance report including a waterfall of all page resources and their load times. |
| Why is my website fast on desktop but slow on mobile? | Mobile performance scores are almost always significantly lower than desktop scores for several reasons. Mobile devices have less processing power and memory than desktop computers, so JavaScript execution and image decoding take longer. Mobile connections (even 4G/5G) have more variable latency than wired connections. And Google PageSpeed Insights simulates a mid-range Android device on a 4G connection for its mobile test — which represents a conservative real-world benchmark. The most common causes of particularly poor mobile scores are heavy JavaScript bundles, large unoptimised hero images (especially the LCP image), and third-party scripts that have high JavaScript execution costs. Fixing these specifically improves mobile scores disproportionately. |
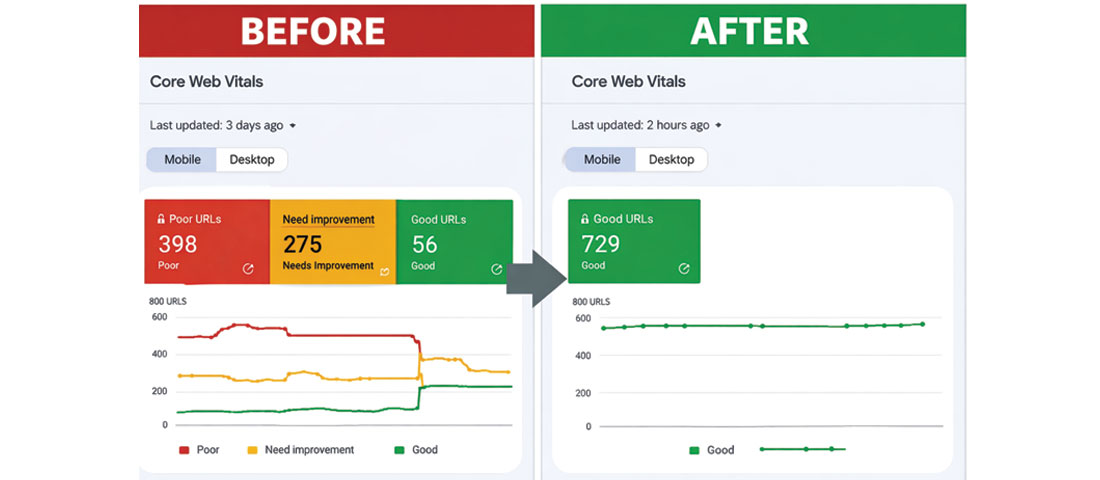
The measurable outcome of a thorough speed optimisation project: moving from “Poor” and “Needs Improvement” Core Web Vitals to the “Good” range — with direct benefits for both Google rankings and visitor conversion rates.
Is your website fast enough to compete in 2026?
Neel Networks provides website performance audits and speed optimisation services for businesses across the USA, UK, Canada, and Australia. We identify the specific issues dragging your scores down and fix them — measurably improving your Core Web Vitals, your search rankings, and your conversion rates.
Website Performance Services Get a Free Performance Audit WhatsApp Us